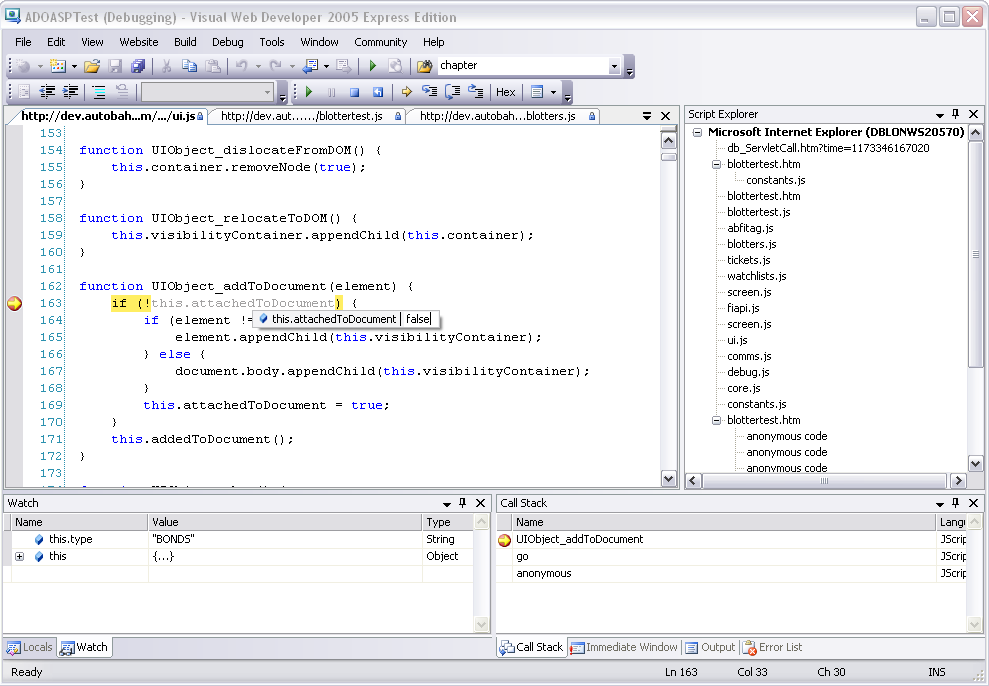
I want to share with you a trick for getting a world-class debugger for free in IE.

Some background: users of Visual Studio have long known that it comes with an awesome debugger, probably the best JavaScript debugger there is (though Firebug is catching up fast). Whenever you get a JavaScript error, Visual Studio can connect to the Internet Explorer process and start debugging. You can pause the execution of the code, rewind and fast-forward execution, modify data held in variables and get notified when specific variables change in value. Once you’re used to it, coding without a debugger makes you feel like a blind man in a dark room looking for a black cat that isn’t there*.
Continue reading How to debug JavaScript in Internet Explorer